About
This registry exists to help people discover and share collections that are available via Euro Data Cube
See all usage examples for collections listed in this registry tagged with on-demand.
Search collections (currently 13 matching collections)
You are currently viewing a subset of data tagged with on-demand.
Add to this registry
If you want to add a collection or example of how to use a collection to this registry, please follow the instructions on the Euro Data Cube Public Collections GitHub repository.
Unless specifically stated in the applicable collection's documentation, collections available through the Euro Data Cube Public Collections are not provided and maintained by Euro Data Cube. Collections are provided and maintained by a variety of third parties under a variety of licenses. Please check collection licenses and related documentation to determine if a collection may be used for your application.
EOxCloudless Sentinel-2 10m Global Cloudless Mosaic
agriculturecloudlesscommercial dataEOXEOxCloudlessglobalmachine learningmapsmulti spectral imageryon-demandrastersatellite imagerysystematic
EOxCloudless Sentinel-2 10m Global Cloudless Mosaic is a derived product, created to provide an almost cloudfree global dataset every year. Details about the EOxCloudless products available at EDC are provided on the Additional info page. For a detailed description of the generally available products please refer to EOxCloudless.
Usage examples
E8 indicator
backscatter signalCopernicusCOVID-19 effectse8metal objectsmotor vehicle manufacturingon-demandrace challengesradarSARsentinel hub
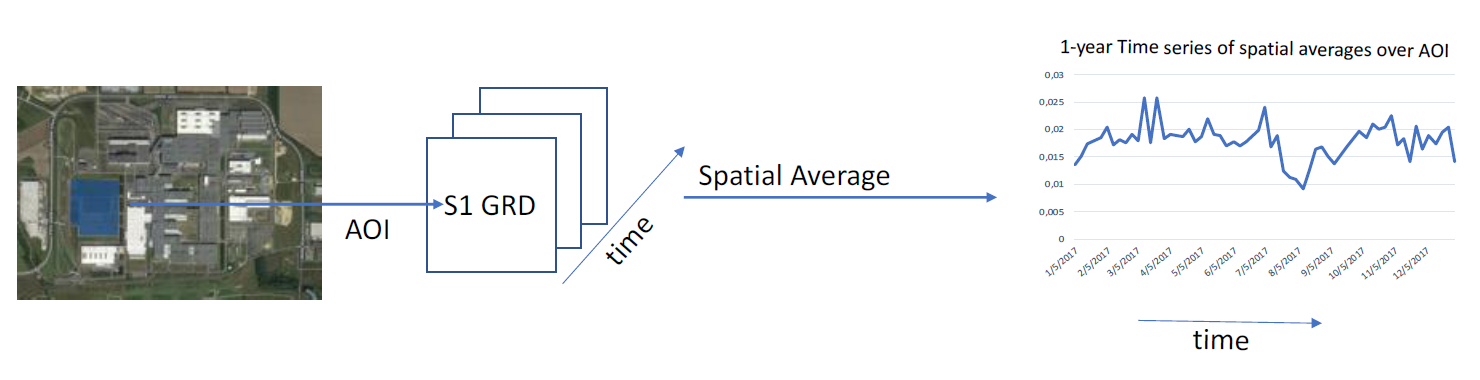
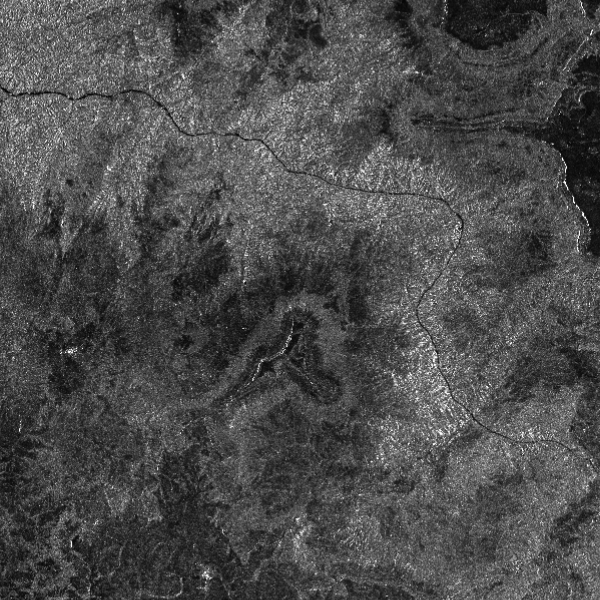
The indicator E8 measures COVID-19 lockdown effects on output inventory level at finished goods production sites. To contain COVID-19 pandemic, EU Member States have taken a restricitve measures. According to EUROSTAT, these imposed measures had in general a negative effect on demand and thus on industrial production in many areas.At the logistic areas operated at the production sites such as motor vehicle manufacturing, the large number of metal objects (e.g. machinery, vehicles) produces a strong signature in the radar backscatter signal. The observations provided by the Synthetic Aperture Radar satellites such as the C-band Copernicus Sentinel-1 or the X-band Iceye satellites permit comparative measurements between 2019 and 2020 of the average backscatter signal at the output logistic areas.The output of the indicator E8 algorithm is a CSV file containing statistics of Sentinel-1 backscatter signal for selected aoi and time period.To generate the indicator E8 data, navigate to EDC Browser, select t...
Field Delineation
derived datafield delineationon-demandsentinel hubsentinel-2
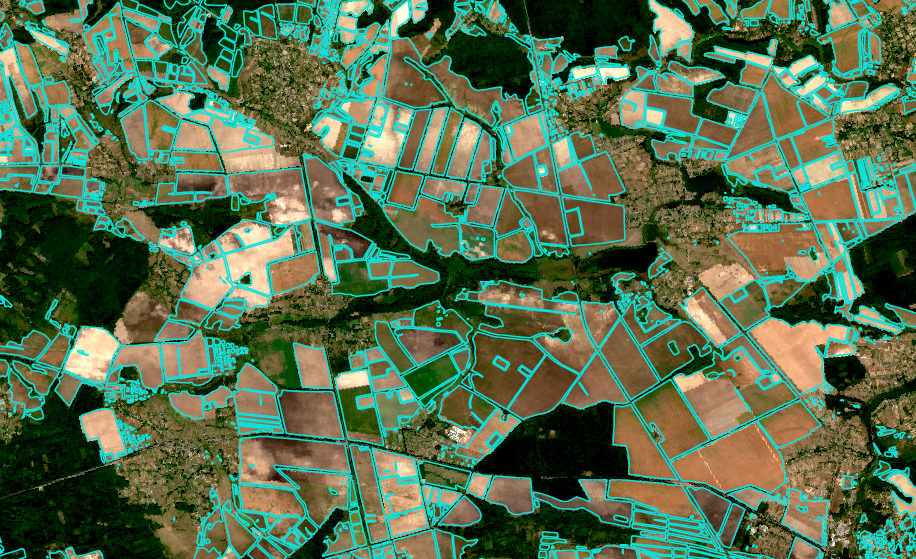
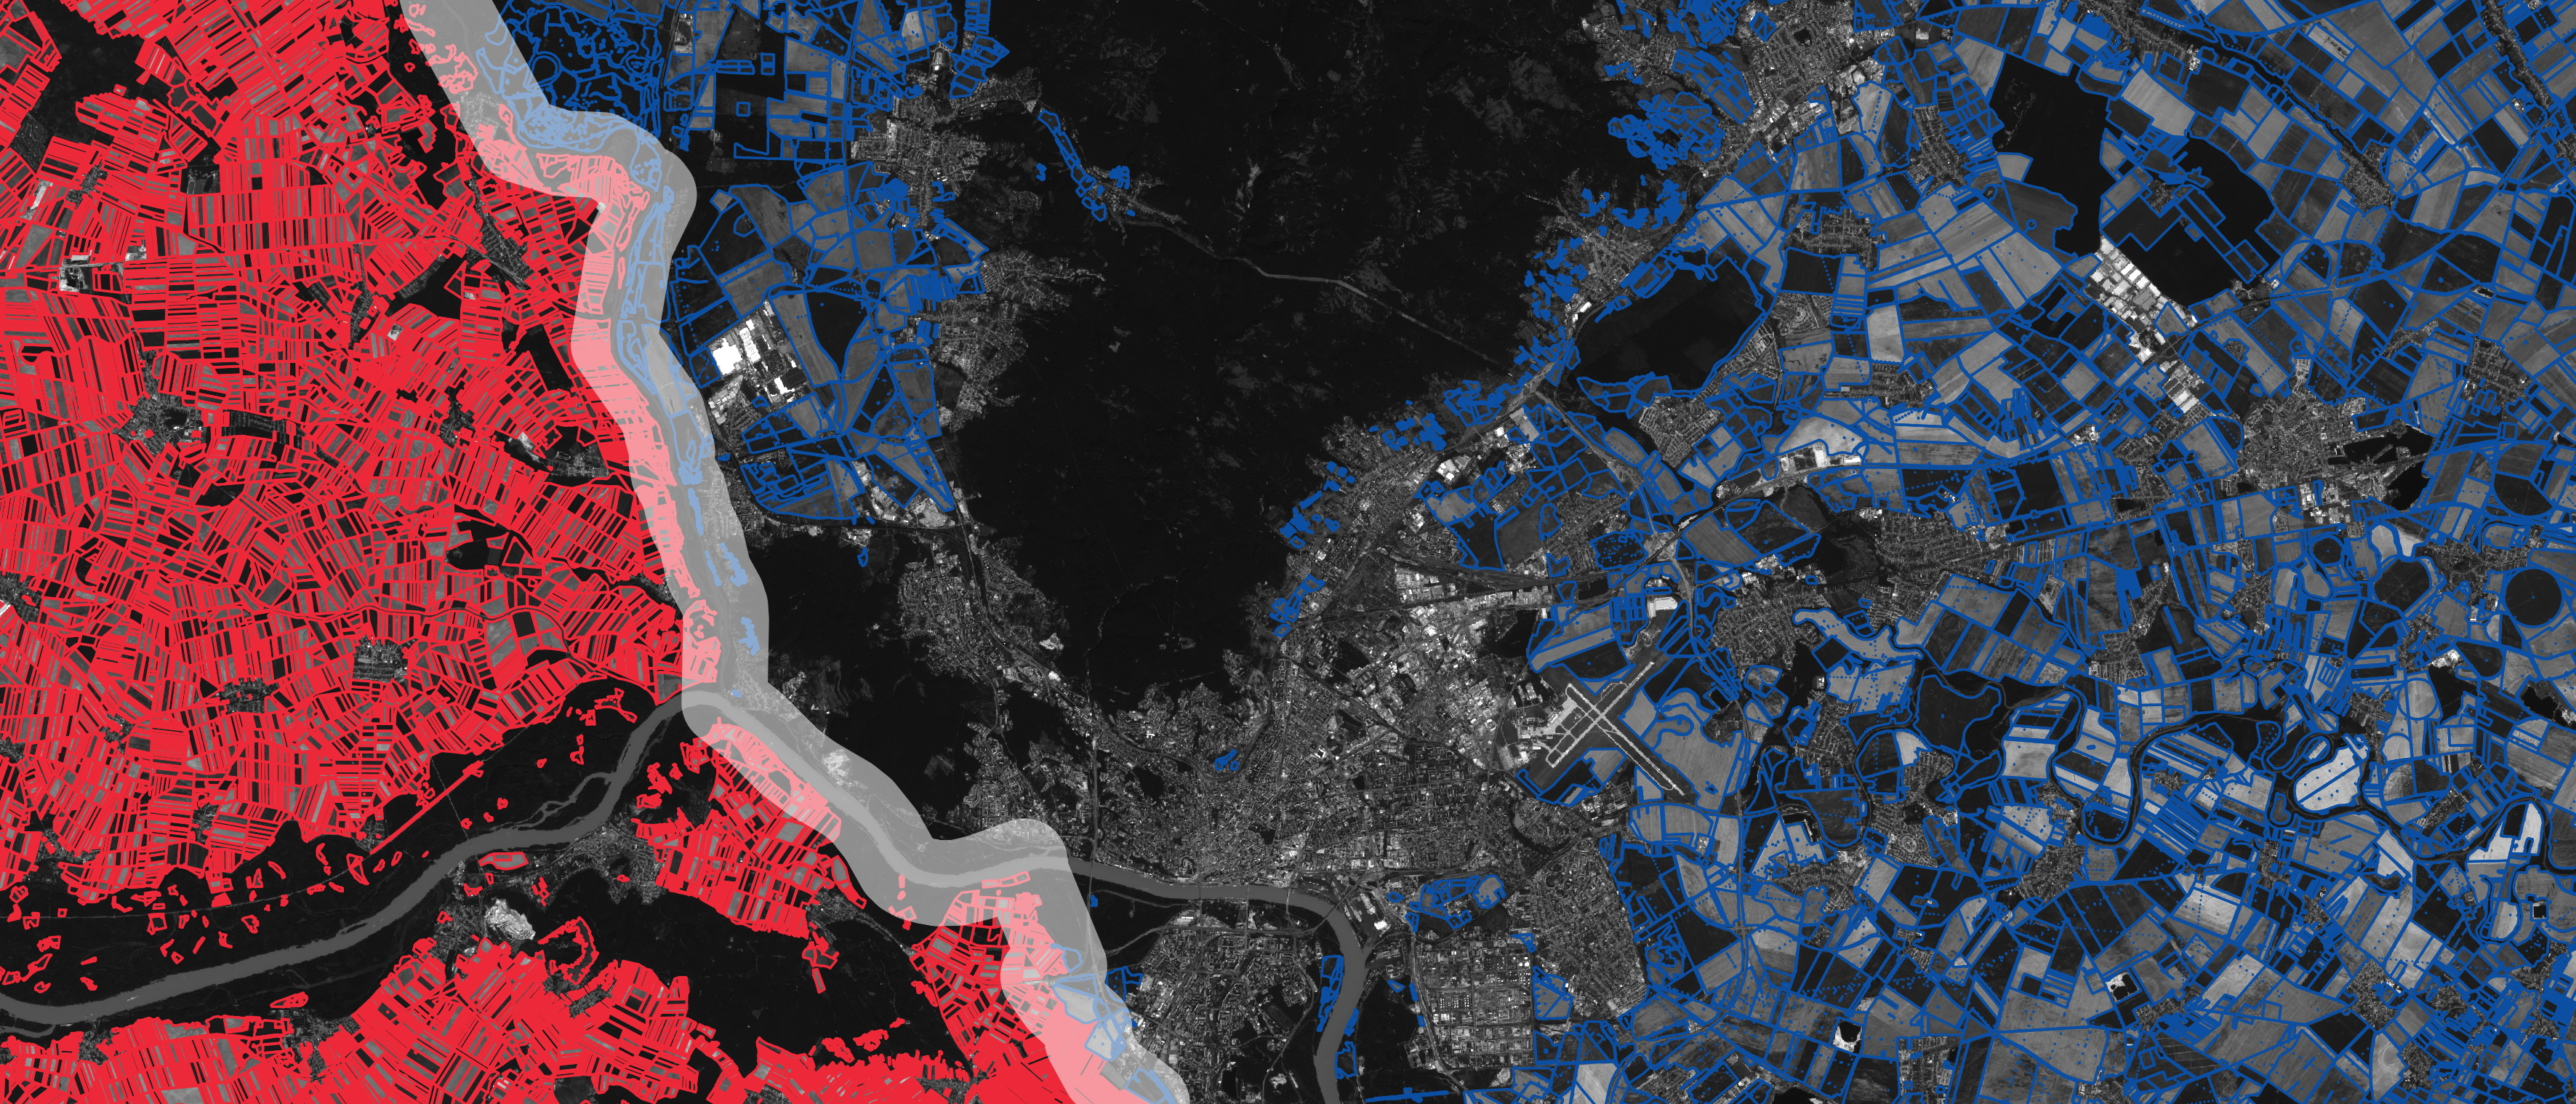
An algorithm for automatic delineation of agricultural field boundaries from Sentinel-2 imagery.The main part of the algorithm is an advanced pre-trained machine learning model. It was trained on multiple locations throughout Europe for a time interval from March to August.The algorithm is an improved version of the one developed for NIVA project. More information about the process is available in a blog post and in a recording of a webinar.To run the field delineation process, navigate to EDC Browser, select the required input parameters and follow the check-out wizard to complete your order...
Operational Sentinel-3 snow and ice products (SICE)
derived Dataolcion-demandpolar productssentinel hubsentinel-3
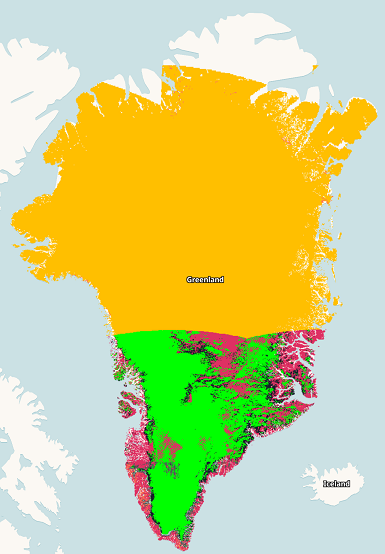
Operational Sentinel-3 snow and ice products (SICE) is a modification of the original algorithm developed by the Geological Survey of Denmark and Greenland (GEUS) which is available here. The algorithms were originally developed after the work from Kokhanovsky et al. (2018, 2019, 2020). The EDC SICE algorithm produces the same results but it's integrated with the Sentinel Hub infrastructure which allows the user to obtain the results much faster and at higher resolutions. The algorithm uses the already geopositioned and orthorectified S3 - Ocean and Land Color Instrument (OLCI) data provided by Sentinel Hub API in order to calculate different snow optical properties such as snow spectral and broadband albedo and also snow microstructure (snow specific surface area and effective optical grain size). Theoretical basis of the algorithm can be obtained here and here. Since the algorithm relies heavily on the sun zenith angle (SZA), the best results for the northern polar regions can be obtained for the periods between May and September (depending on the location Latitude). To generate the SICE data, navigate to EDC Browser, select the required input parameters and follow the check-out wizard to complete your order. Produced data will be uploaded directly in...
SMOS Datacube Service
analysis-readydatacubeon-demandSMOS

ESA SMOS Level-2 data
in form of analysis-ready Level-2C datacubes with the dimensions
time, lat, and lon.
The datacube is provided in
Zarr format (.zarr).
Sentinel-1 GRD CARD4L Processing
card4lcopernicuson-demandradiometric terrain correctionrasterSARsentinelsentinel hub
Sentinel Hub provides the full archive of global Sentinel-1 GRD data, which can be processed based on CARD4L NRB (Normalised Radar Backscatter) requirements to reduce the complexity of SAR data. The satellite data is processed to a minimum set of requirements and organized into a form, that allows immediate analysis with minimum user effort. Through the Euro Data Cube Insights On Demand service, you can trigger on-demand processing of CARD4L compliant Sentinel-1 GRD data through EDC Browser and have the products delivered to a specified S3 bucket.
To access sample processed data, we provide freely accessible Sentinel-1 GRD archived CARD4L data covering Africa Continent here, in collaboration with Geoscience Australi...
Sentinel-2 signals for EuroCrops
crops productsderived Dataon-demandsentinel hubsentinel-2
Sentinel-2 signals for EuroCrops is a dataset collection combining all publicly available self-declared crop reporting datasets from countries of the European Union. The project is funded by the German Space Agency at DLR on behalf of the Federal Ministry for Economic Affairs and Climate Action (BMWK). This work is licensed under a Creative Commons Attribution 4.0 International License.An algorithm for retrieval of Eurocrops Sentinel-2 signals based on an area of interest.The algorithm allows the users to specify:
- an area-of-interest (AoI);
- a time interval for which they want to retrieve Sentinel-2 data;
- an evalscript specifying which Sentinel-2 bands or derived indices, e.g. NDVI, to download.
- Retrieve Sentinel-2 signals for EuroCrops parcels for a chosen AoI. This is done with the help of GeoDB.
- The parcels are saved to the specified folder on the user's AWS S3 bucket.
- Retrieve signals for the parcels in the AoI for the specified time interval using Sentinel Hub Batch Statistical API.
- The signals are downloaded to the user's AWS S3 bucket in the form of
.jsonfi...
Truck Detection
derived Dataon-demandsentinel hubsentinel-2truck detection
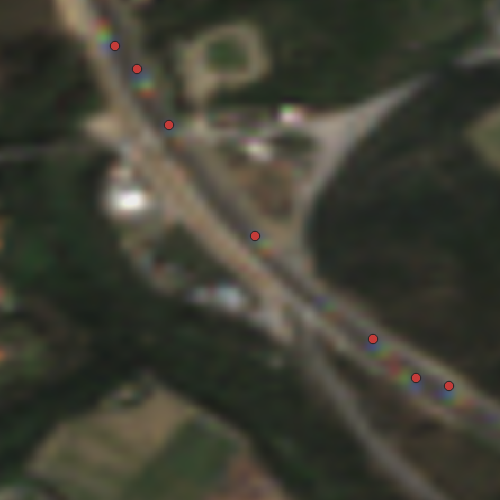
The Truck Detection algorithm detects the number of moving trucks along roads using 10m resolution Sentinel-2 level 2A data.
The author Henrik Fisser (henrik.fisser@t-online.de), developed this algorithm (with the title: Truck detection – Sensing trade from space) in the context of the Euro Data Cube COVID-19 edition of Sentinel Hub’s custom script contest.
The algorithm exploits the small offset between Sentinel-2 bands which causes moving objects to appear as rainbows in RGB images allowing the detection and mapping of moving trucks.
The output of the algorithm is point vector data ( GeoPackage (.gpkg) format) with the coordinates of the detected trucks, dates of detected trucks and the valid road area as attributes. More information regarding input and output specifications can be found under additional information.
To generate trucks vector data, navigate to EDC Browser, select...
Urban Delineation - GHSL
derived dataghslon-demandurban delineationvectorxcube
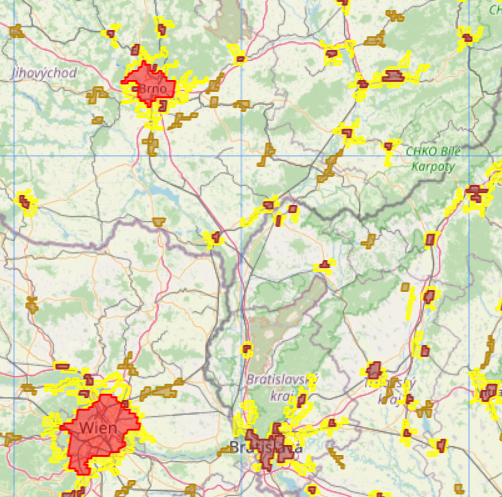
Urban delineation algorithm classify and delineate urban clusters by typologies. Method was developed by Joint Research Centre (JRC) and described in Atlas of Human Planet 2019 The algorithm uses the global-coverage built-up (GHS-BUILT-S_GLOBE_R2022A) and population (GHS-POP_GLOBE_R2022A) raster datasets as the input data (JRC’s GHSL). The algorithm classifies and delineates urban clusters at two hierarchical levels. At the first hierarchical level, the algorithm identifies the High Density Clusters (Urban Centre) and Moderate Density Clusters. At the second hierarchical level, the algorithm ...
Urban Delineation - WSF
derived dataon-demandurban delineationvectorwsfxcube

Urban delineation algorithm classify and delineate urban clusters by typologies. Method was developed by Joint Research Centre (JRC) and described in Atlas of Human Planet 2019. This version of the Urban Delineation algorithm has been adapted to utilize the WSF2019population dataset at a resolution of 10 meters. The WSF2019population dataset is provided by the German Aerospace Center (DLR) and describes the spatial distribution of the human population. This dataset is currently available for Bolivia, Chile, Kenya and Myanmar. User-defined area of interest (aoi) per order is limited to 10.000 k...
Urban Delineation DLR - WSF
derived dataDLRon-demandurban delineationvectorwsfxcube
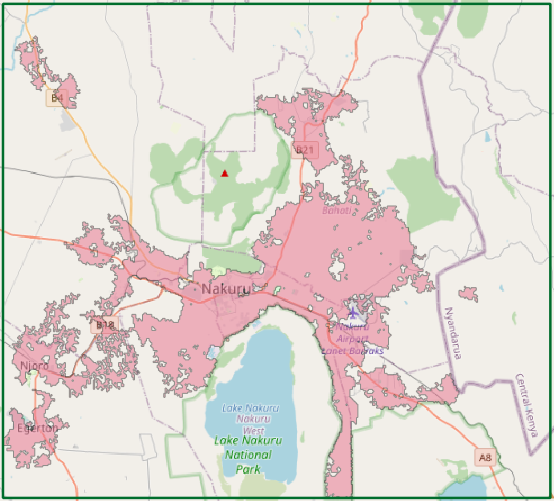
This Urban Delineation algorithm delineates urban clusters using a method developed by the German Aerospace Center (DLR). The algorithm based on this method is integrated here in the form of Docker developed in DLR. Integrated algorithm utilizes the latest version of the WSF population dataset at a resolution of 10 meters. This dataset is available for reference years 2016-2023. The WSF population dataset is provided by the German Aerospace Center and describes the spatial distribution of the human population. Presently, this dataset is accessible for Kenya. Datasets for Bolivia, Chile, and My...