About
This registry exists to help people discover and share collections that are available via Euro Data Cube
See all usage examples for collections listed in this registry tagged with race challenges.
Search collections (currently 13 matching collections)
You are currently viewing a subset of data tagged with race challenges.
Add to this registry
If you want to add a collection or example of how to use a collection to this registry, please follow the instructions on the Euro Data Cube Public Collections GitHub repository.
Unless specifically stated in the applicable collection's documentation, collections available through the Euro Data Cube Public Collections are not provided and maintained by Euro Data Cube. Collections are provided and maintained by a variety of third parties under a variety of licenses. Please check collection licenses and related documentation to determine if a collection may be used for your application.
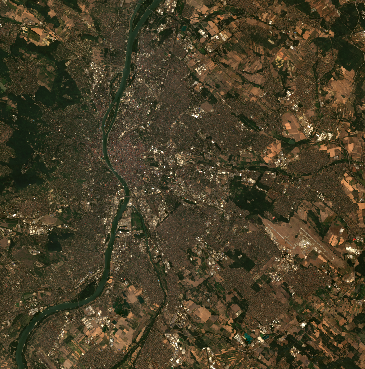
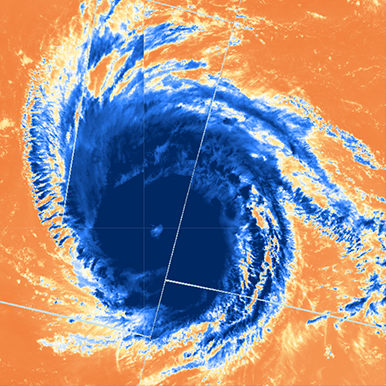
Sentinel-1 GRD
backscatteringCopernicusdisaster responseland monitoringmaritime monitoringopen datapolarizationrace challengesradarrasterSARsatellite imagerysentinelsentinel hubsystematicxcube
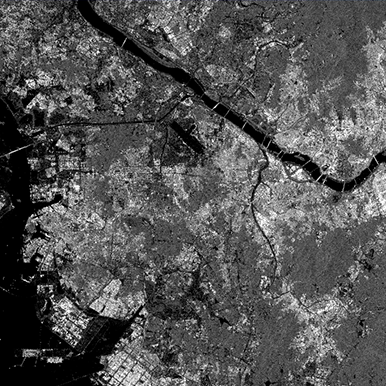
The Sentinel-1 radar imaging mission is composed of a constellation of two polar-orbiting satellites providing continous all-weather, day and night imagery for Land and Maritime Monitoring. C-band synthentic aperture radar imaging has the advantage of operating at wavelenghts that are not obstructed by clouds or lack of illumination and therefore can acquire data during day or night under all weather conditions. With 6 days repeat cycle on the entire world and daily acquistions of sea ice zones and Europe's major shipping routes, Sentinel-1 ensures reliable data availability to support eme...
Usage examples
BICEP
open datarace challengesrastersentinel hub
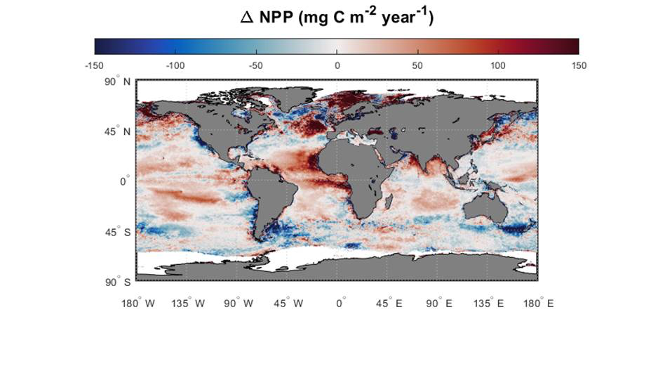
This dataset contains global, monthly marine phytoplankton primary production products (in mg C m-2 d-1) for the period of 1998 to 2020 at 9 km spatial resolution. Data are provided in ZARR format with monthly averages.
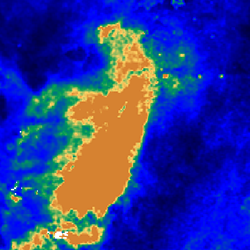
CAMS_GLC_2017
open datarace challengesrastersentinel hub
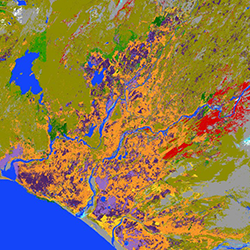
The S2GLC 2017 product represents land cover classification of a major portion of the European continent. The classification has been performed using multi-temporal Sentinel-2 data collected during the year 2017 with the methodology developed in the frame of the Sentinel-2 Global Land Cover (S2GLC) project. The S2GLC 2017 dataset is delivered with 10 m spatial resolution with thematic legend composed of 13 land cover classes
CHL_water_quality_Saturday
open datarace challengesrastersentinel hub
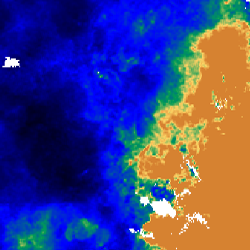
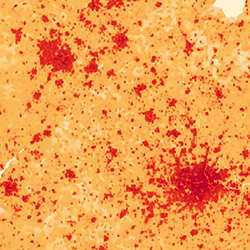
Chlorophyll anomaly maps for 3 sites: Lagoon Venice, Marseille and Barcelona regions
CO 3daily data
open datarace challengesrastersentinel hub
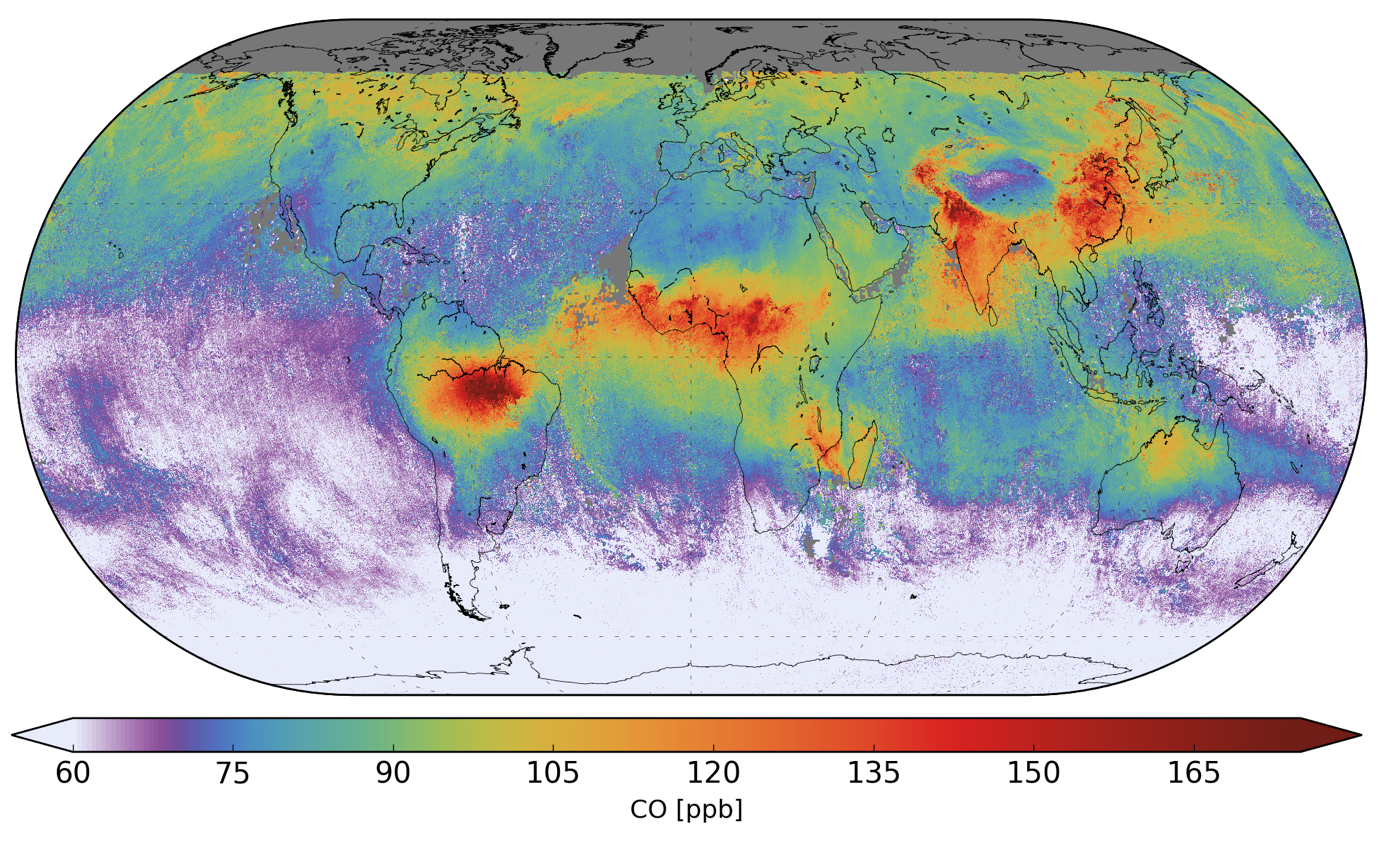
This online platform uses data from the Copernicus Sentinel-5P satellite and shows the averaged carbon monoxide concentrations across the globe — using a 3-day moving average. Using a 3 day average eliminates most data gaps and improves data quality by reducing random noise. Satellite measurements of concentrations of pollutants like Carbon Monoxide, having a life-time in the atmosphere of about 1 month, can be used to monitor trans-boundary movement of air pollution. Carbon monoxide (CO) is a colorless, odorless, and tasteless gas that is toxic to humans as it can disrupt the transport of oxy...
E12C_Motorway
open datarace challengesrastersentinel hub
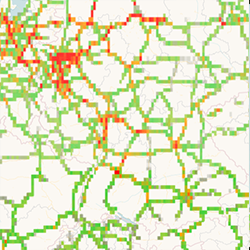
This indicator is based on the detection of moving trucks on motorways in the EU. The detection uses data from the Copernicus Sentinel-2 satellite.
E12D_Primary_corrected
open datarace challengesrastersentinel hub
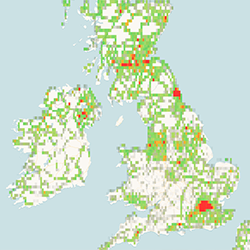
This indicator is based on the detection of moving trucks on motorways in the EU. The detection uses data from the Copernicus Sentinel-2 satellite.
E8 indicator
backscatter signalCopernicusCOVID-19 effectse8metal objectsmotor vehicle manufacturingon-demandrace challengesradarSARsentinel hub
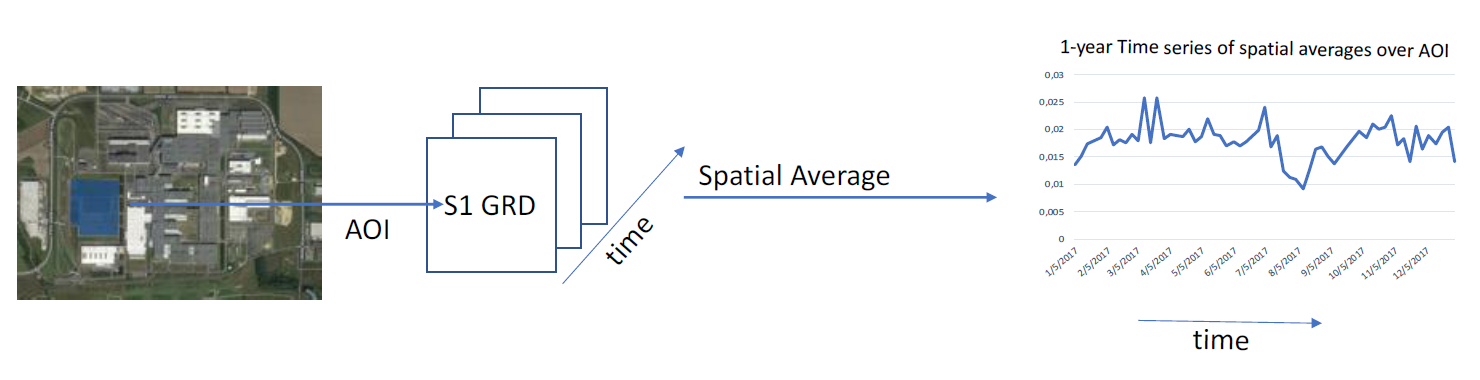
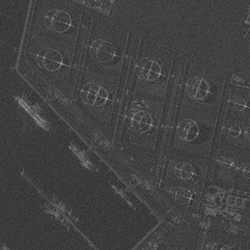
The indicator E8 measures COVID-19 lockdown effects on output inventory level at finished goods production sites. To contain COVID-19 pandemic, EU Member States have taken a restricitve measures. According to EUROSTAT, these imposed measures had in general a negative effect on demand and thus on industrial production in many areas.At the logistic areas operated at the production sites such as motor vehicle manufacturing, the large number of metal objects (e.g. machinery, vehicles) produces a strong signature in the radar backscatter signal. The observations provided by the Synthetic Aperture Radar satellites such as the C-band Copernicus Sentinel-1 or the X-band Iceye satellites permit comparative measurements between 2019 and 2020 of the average backscatter signal at the output logistic areas.The output of the indicator E8 algorithm is a CSV file containing statistics of Sentinel-1 backscatter signal for selected aoi and time period.To generate the indicator E8 data, navigate to EDC Browser, select t...
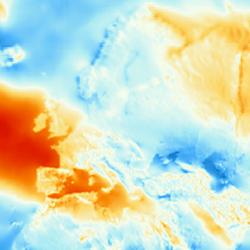
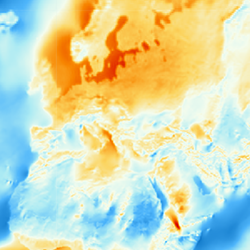
ERA5 2m Temperature 2020 Monthly Average
C3Scopernicus servicesopen datarace challengesrastersentinel hub

Gridded ERA5 is the fifth generation ECMWF reanalysis for the global climate and weather for the past 4 to 7 decades. This parameter is the 2m temperature monthly average
Harmonized Landsat Sentinel
agriculturecopernicusdisaster responselandsatLULC changeLULC mappingmulti spectral imagerynatural resourceopen datarace challengesrastersatellite imagerysentinelsentinel hubsystematicvegetation monitoringxcube
Harmonized Landsat Sentinel is a NASA initiative to produce a Virtual Constellation of surface reflectance (SR) data from the Operational Land Manager (OLI) and Multi-Spectral Instrument (MSI) aboard the Landsat 8-9 and Sentinel-2 remote sensing satellites, respectively. The combined measurement enables global observations of the land every 2-3 days. Input products are Landsat 8-9 Collection 2 L1 and S2-L1C top-of-atmosphere reflectance. Landsat data is available from April 2013 and Sentinel-2 data from November 2015.
ICEYE_E11
open datarace challengesrastersentinel hub
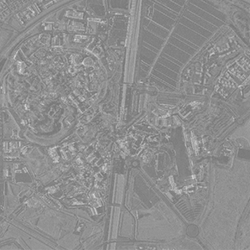
Activity for Leisure industry reduced. Images from ICEYE
ICEYE_E11a
open datarace challengesrastersentinel hub
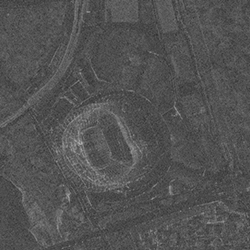
Activity at leisure facility (Stadium) affected by COVID
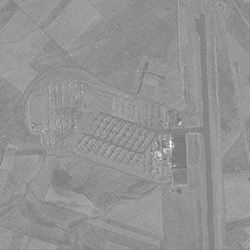
ICEYE_E3
open datarace challengesrastersentinel hub
Oil storages filling up as demand for oil decreases when people are not travelling
Population_density
open datarace challengesrastersentinel hub
Gridded Population of the World v4 for year 2020
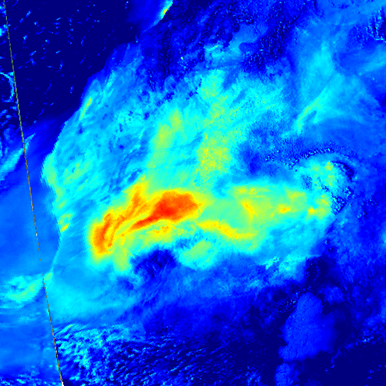
S5P CH4 weekly
open datarace challengesrastersentinel hub
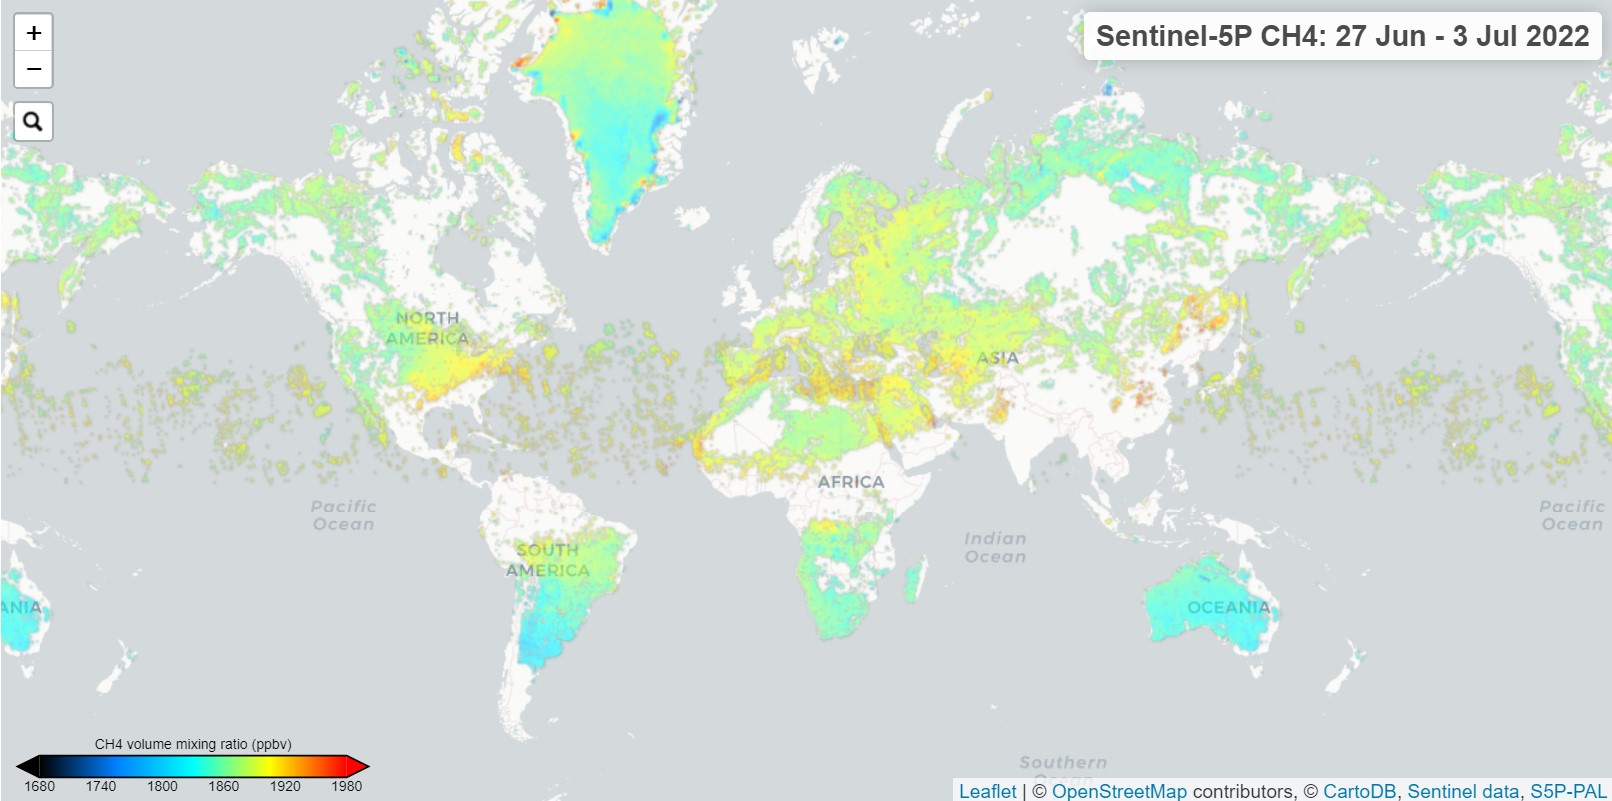
The data comes from the Copernicus Sentinel-5P satellite and uses data from the Copernicus Sentinel-5P satellite and shows the averaged methane concentrations across the globe — using weekly averaged maps. The methane map shown here is measured by the Tropomi instrument on the Sentinel 5 Precursor satellite. The Copernicus Sentinel-5P CH4 measurements were first filtered according to the recommendation in the Product Readme file (only data with a qa_value > 0.50 was used). Then the measurements are mapped on a fixed latitude-longitude grid of 4096 x 8192 pixels. The grid is turned into an E...
S5P-NO2-tropno-daily-check
open datarace challengesrastersentinel hub
The data comes from the Copernicus Sentinel-5P satellite and shows the averaged nitrogen dioxide concentrations across the globe – using a 14-day moving average. Concentrations of short-lived pollutants, such as nitrogen dioxide, are indicators of changes in economic slowdowns and are comparable to changes in emissions. Using a 14 day average eliminates some effects which are caused by short term weather changes and cloud cover. The average gives an overview over the whole time period and therefore reflects trends better than shorter time periods.
SO2 daily data
open datarace challengesrastersentinel hub
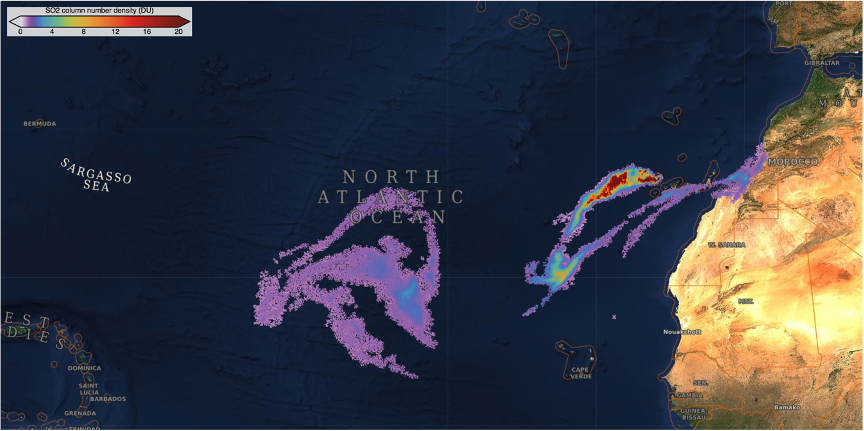
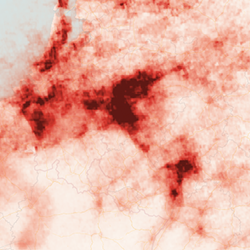
This online platform uses data from the Copernicus Sentinel-5P satellite and shows the daily sulfur dioxide concentrations coming primarily from volcanic sources. The Copernicus Sentinel-5P SO2 measurements are those retrieved assuming SO2 at an altitude of 7km and explicitly filtering for pixels where a volcanic source is most likely (sulfurdioxide_detection_flag > 0) and where the solar zenith angle is within limits (SZA < 70°). The measurements are then mapped on a fixed latitude-longitude grid of 8193 x 16385 pixels. The grid is turned into an EPSG:4326 geotiff file using the appropr...
Sentinel-2 L1C
agriculturecopernicusdisaster responsemulti spectral imagerynatural resourceopen datarace challengesrastersatellite imagerysentinelsentinel hubsystematicxcube
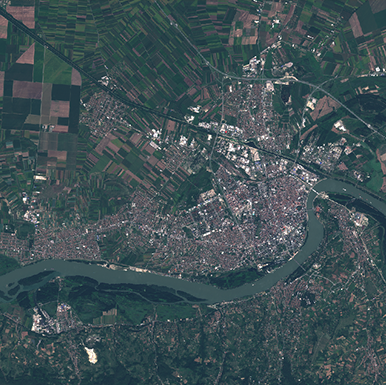
The Sentinel-2 mission is a land monitoring constellation of two satellites that provide high resolution optical imagery and provide continuity for the current SPOT and Landsat missions. The mission provides a global coverage of the Earth's land surface every 5 days, making the data of great use in on-going studies. L1C data are available from June 2015 globally. L1C data provide Top of the atmosphere (TOA) reflectance.
Sentinel-2 L2A
agriculturecopernicusdisaster responsemulti spectral imagerynatural resourceopen datarace challengesrastersatellite imagerysentinelsentinel hubsystematicxcube
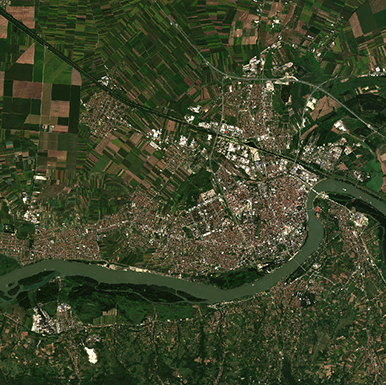
The Sentinel-2 mission is a land monitoring constellation of two satellites that provide high resolution optical imagery and provide continuity for the current SPOT and Landsat missions. The mission provides a global coverage of the Earth's land surface every 5 days, making the data of great use in on-going studies. L2A data are available from September 2016 over wider Europe region and globally since January 2017. L2A data provide Bottom of the atmosphere (BOA) reflectance.
Sentinel-3 OLCI L1B
atmospheric aerosolsclimatecopernicusmarine biologymaritime monitoringmulti spectral imageryopen dataOTCIrace challengesrastersatellite imagerysentinelsentinel hubsystematicxcube
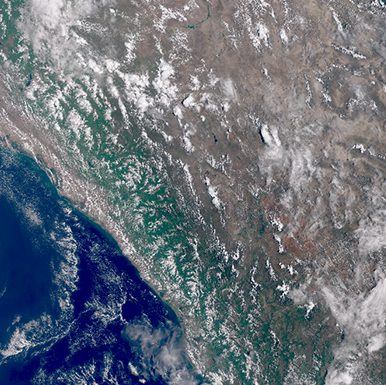
The Sentinel -3 is composed of three versatile satellites designed to provide data continuity for the ERS, ENVISAT and SPOT satellites and to support operational land and ocean observataion services. Sentinel -3 satellites make use of four main instruments on board; OLCI, SLSTR, SRAL and MWR, to measure sea surface topography, sea and land surface temperature and ocean and land surface color. The medium resolution OLCI(Ocean and Land Colour Instrument) is the successor to ENVISAT's MERIS instrument. Since its launch in 2016, OLCI acquires data of the entire globe atleast every 2 days, i...
Sentinel-3 SLSTR L1B
active firesatmospheric aerosolsclimatecopernicusLSTmulti spectral imageryopen datarace challengesrastersentinelsentinel hubSSTsystematicxcube
The Sentinel -3 is composed of three versatile satellites designed to provide data continuity for the ERS, ENVISAT and SPOT satellites and to support operational land and ocean observation services. Sentinel -3 satellites make use of four main instruments on board; OLCI, SLSTR, SRAL and MWR, to measure sea surface topography, sea and land surface temperature and ocean and land surface color. The SLSTR (Sea and Land Surface Temperature Radiometer ) continues the timeline of Sea Surface Temperature measurements from the ATSR instrument series. The principal objective of SLSTR products is to p...
Sentinel-5P L2
aerosolsair qualityclimate changecopernicusforecastingN02open dataozonerace challengesrastersentinelsentinel hubsystematicxcube
The Copernicus Sentinel-5 Precursor mission dedicated to monitoring our atmosphere, consists of one satellite carrying the TROPOspheric Monitoring Instrument (TROPOMI) instrument. Sentinel-5 Precursor mission aims to fill in global atmospheric data gap between the retired ENVISAT and AURA missions and the future Sentinel -5 mission.The main objective of TROPOMI is provide daily global observations of key atmospheric constituents related to air quality, ozone layer and climate change monitoring and forecasting. Level 2 data provide total columns of ozone, sulfur dioxide, nitrogen dioxide, car...
TSMN_water_quality_Saturday
open datarace challengesrastersentinel hub
Total suspended matter maps for 3 sites: Lagoon Venice, Marseille and Barcelona regions
Vessel_Density_All
C3Scopernicus servicesopen datarace challengesrastersentinel hub
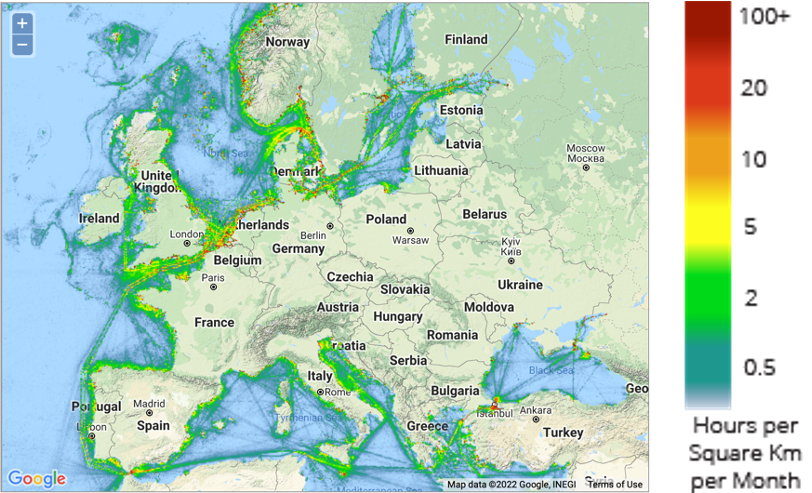
The Vessel Density maps in the EU are created since the 2019 by Cogea for the European Marine Observation and Data Network (EMODnet). The dataset is updated every year and is available for viewing and download on EMODnet Human Activities web portal (www.emodnet-humanactivities.eu). The maps are based on AIS data yearly purchased from Collecte Localisation Satellites (CLS) and ORBCOMM. The maps, GeoTIFF format, show shipping density in 1x1km cells of a grid covering all EU waters and some neighbouring areas. Density is expressed as hours per square kilometre per month. The following ship types ...
Vessel_Density_cargo
C3Scopernicus servicesopen datarace challengesrastersentinel hub
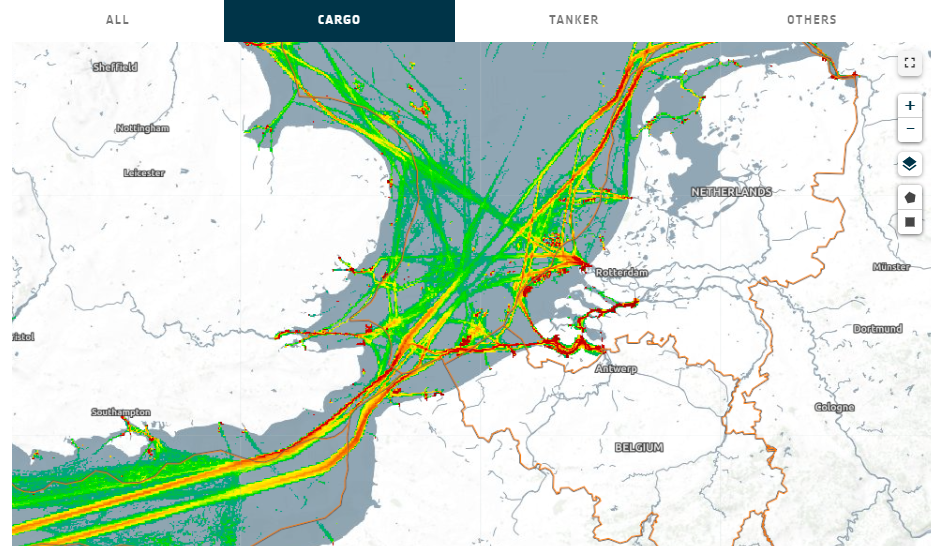
The Vessel Density maps in the EU are created since the 2019 by Cogea for the European Marine Observation and Data Network (EMODnet). The dataset is updated every year and is available for viewing and download on EMODnet Human Activities web portal (www.emodnet-humanactivities.eu). The maps are based on AIS data yearly purchased from Collecte Localisation Satellites (CLS) and ORBCOMM. The maps, GeoTIFF format, show shipping density in 1x1km cells of a grid covering all EU waters and some neighbouring areas. Density is expressed as hours per square kilometre per month. The following ship types ...
Vessel_Density_other
C3Scopernicus servicesopen datarace challengesrastersentinel hub
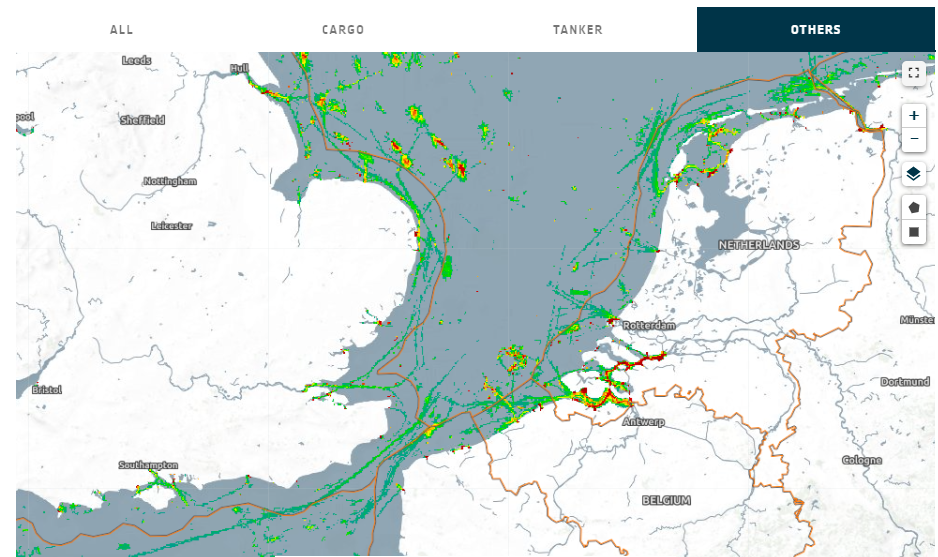
The Vessel Density maps in the EU are created since the 2019 by Cogea for the European Marine Observation and Data Network (EMODnet). The dataset is updated every year and is available for viewing and download on EMODnet Human Activities web portal (www.emodnet-humanactivities.eu). The maps are based on AIS data yearly purchased from Collecte Localisation Satellites (CLS) and ORBCOMM. The maps, GeoTIFF format, show shipping density in 1x1km cells of a grid covering all EU waters and some neighbouring areas. Density is expressed as hours per square kilometre per month. The following ship types ...
Vessel_Density_tanker
C3Scopernicus servicesopen datarace challengesrastersentinel hub
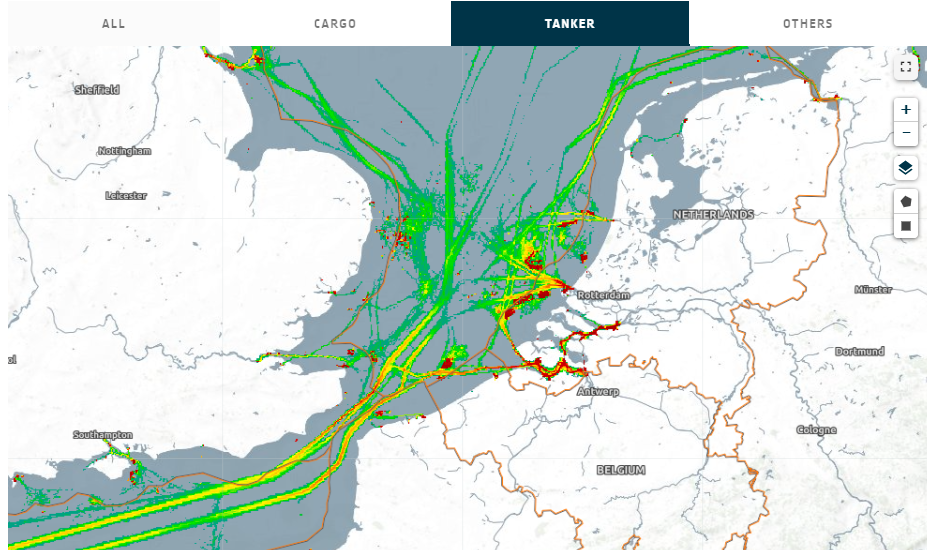
The Vessel Density maps in the EU are created since the 2019 by Cogea for the European Marine Observation and Data Network (EMODnet). The dataset is updated every year and is available for viewing and download on EMODnet Human Activities web portal (www.emodnet-humanactivities.eu). The maps are based on AIS data yearly purchased from Collecte Localisation Satellites (CLS) and ORBCOMM. The maps, GeoTIFF format, show shipping density in 1x1km cells of a grid covering all EU waters and some neighbouring areas. Density is expressed as hours per square kilometre per month. The following ship types ...
Wind 10m u
C3Scopernicus servicesopen datarace challengesrastersentinel hub
Gridded ERA5 is the fifth generation ECMWF reanalysis for the global climate and weather for the past 4 to 7 decades. This parameter is the wind U field
Wind 10m v
C3Scopernicus servicesopen datarace challengesrastersentinel hub
Gridded ERA5 is the fifth generation ECMWF reanalysis for the global climate and weather for the past 4 to 7 decades. This parameter is the wind V field