About
This registry exists to help people discover and share collections that are available via Euro Data Cube
See all usage examples for collections listed in this registry tagged with dashboard hackathon.
Search collections (currently 13 matching collections)
You are currently viewing a subset of data tagged with dashboard hackathon.
Add to this registry
If you want to add a collection or example of how to use a collection to this registry, please follow the instructions on the Euro Data Cube Public Collections GitHub repository.
Unless specifically stated in the applicable collection's documentation, collections available through the Euro Data Cube Public Collections are not provided and maintained by Euro Data Cube. Collections are provided and maintained by a variety of third parties under a variety of licenses. Please check collection licenses and related documentation to determine if a collection may be used for your application.
ALOS-2 PALSAR-2 ScanSAR Reference Rice Paddy Field Map
dashboard hackathonJAXAopen datarasterrice paddySARsentinel hub
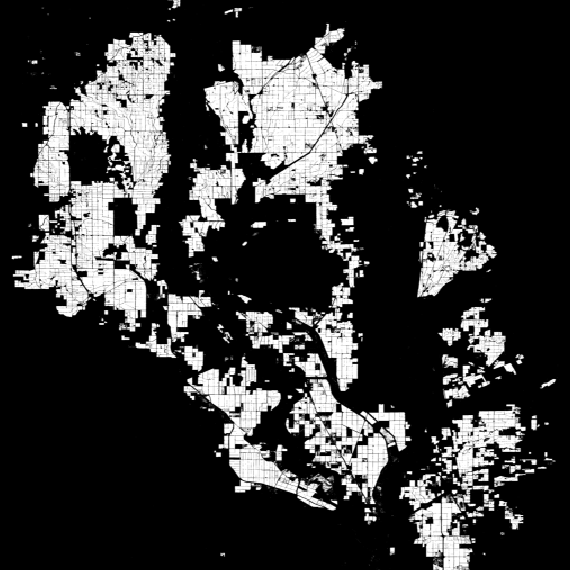
This collection contains reference rice paddy field maps derived from ALOS-2 ScanSAR geometrically corrected (orthorectified) data in selected AOIs between 2019 and 2020 for NASA/ESA/JAXA EODashboard Hackathon. The reference map is described in the digital code as 255: rice paddy field, 0: others.
ALOS-2 PALSAR-2 ScanSAR for Agriculture
dashboard hackathonJAXAopen datarasterSARsentinel hub
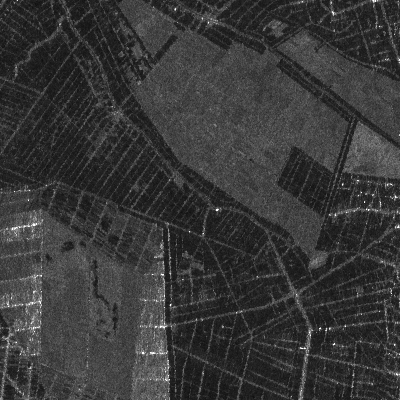
This ALOS-2 ScanSAR L2.1 product contains geometrically corrected (orthorectified) data in selected AOIs between 2019 and 2020 for NASA/ESA/JAXA EODashboard Hackathon. The PALSAR-2 aboard the ALOS-2 is a Synthetic Aperture Radar (SAR), which emits microwave and receives the reflection from the ground to acquire information. Since it does not need other sources of light such as the sun, SAR has the advantage of providing satellite images during day or night. For transmitting and receiving microwaves PALSAR-2 uses the L-band, which is less affected by clouds and rains. This all-weather obse...
ALOS-2 PALSAR-2 Stripmap for Economy (SM1)
dashboard hackathonJAXAopen datarasterSARsentinel hub
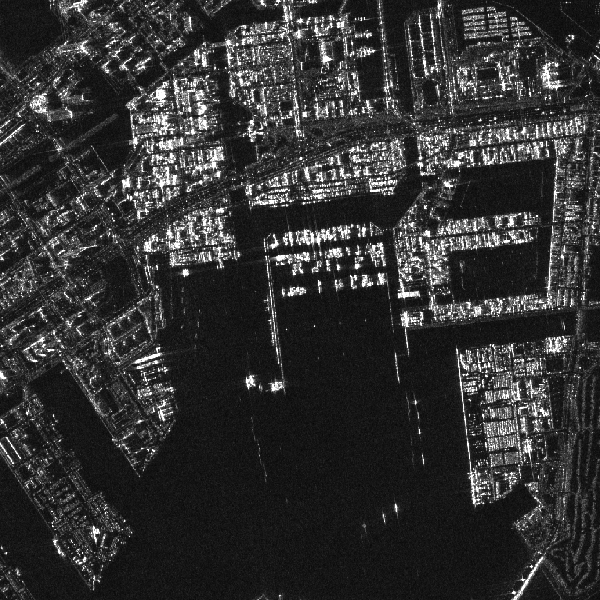
This ALOS-2 PALSAR-2 Strip Map (SM1 with 3m single polarization ) L2.1 product contains geometrically corrected (orthorectified) in selected AOIs between 2019 and 2020 for NASA/ESA/JAXA EODashboard Hackathon. The PALSAR-2 aboard the ALOS-2 is a Synthetic Aperture Radar (SAR), which emits microwave and receives the reflection from the ground to acquire information. Since it does not need other sources of light such as the sun, SAR has the advantage of providing satellite images during day or night. For transmitting and receiving microwaves PALSAR-2 uses the L-band, which is less affected by...
ALOS-2 PALSAR-2 Stripmap for Economy (SM1, SM3)
dashboard hackathonJAXAopen datarasterSARsentinel hub
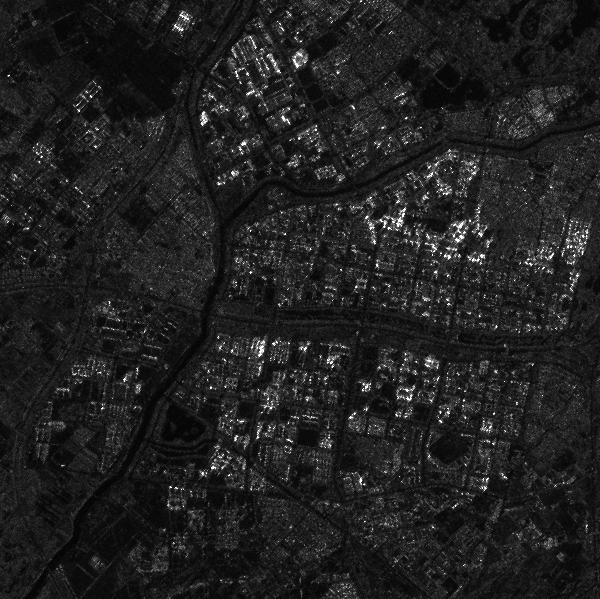
This ALOS-2 PALSAR-2 Strip Map (SM1 with 3m single/dual polarization or SM3 with 10m dual polarization) L2.1 product contains geometrically corrected (orthorectified) in selected AOIs between 2019 and 2020 for NASA/ESA/JAXA EODashboard Hackathon. The PALSAR-2 aboard the ALOS-2 is a Synthetic Aperture Radar (SAR), which emits microwave and receives the reflection from the ground to acquire information. Since it does not need other sources of light such as the sun, SAR has the advantage of providing satellite images during day or night. For transmitting and receiving microwaves PALSAR-2 uses ...
CO2 and CH4 (GOSAT) partial column density
air qualitydashboard hackathonJAXAopen datatime series
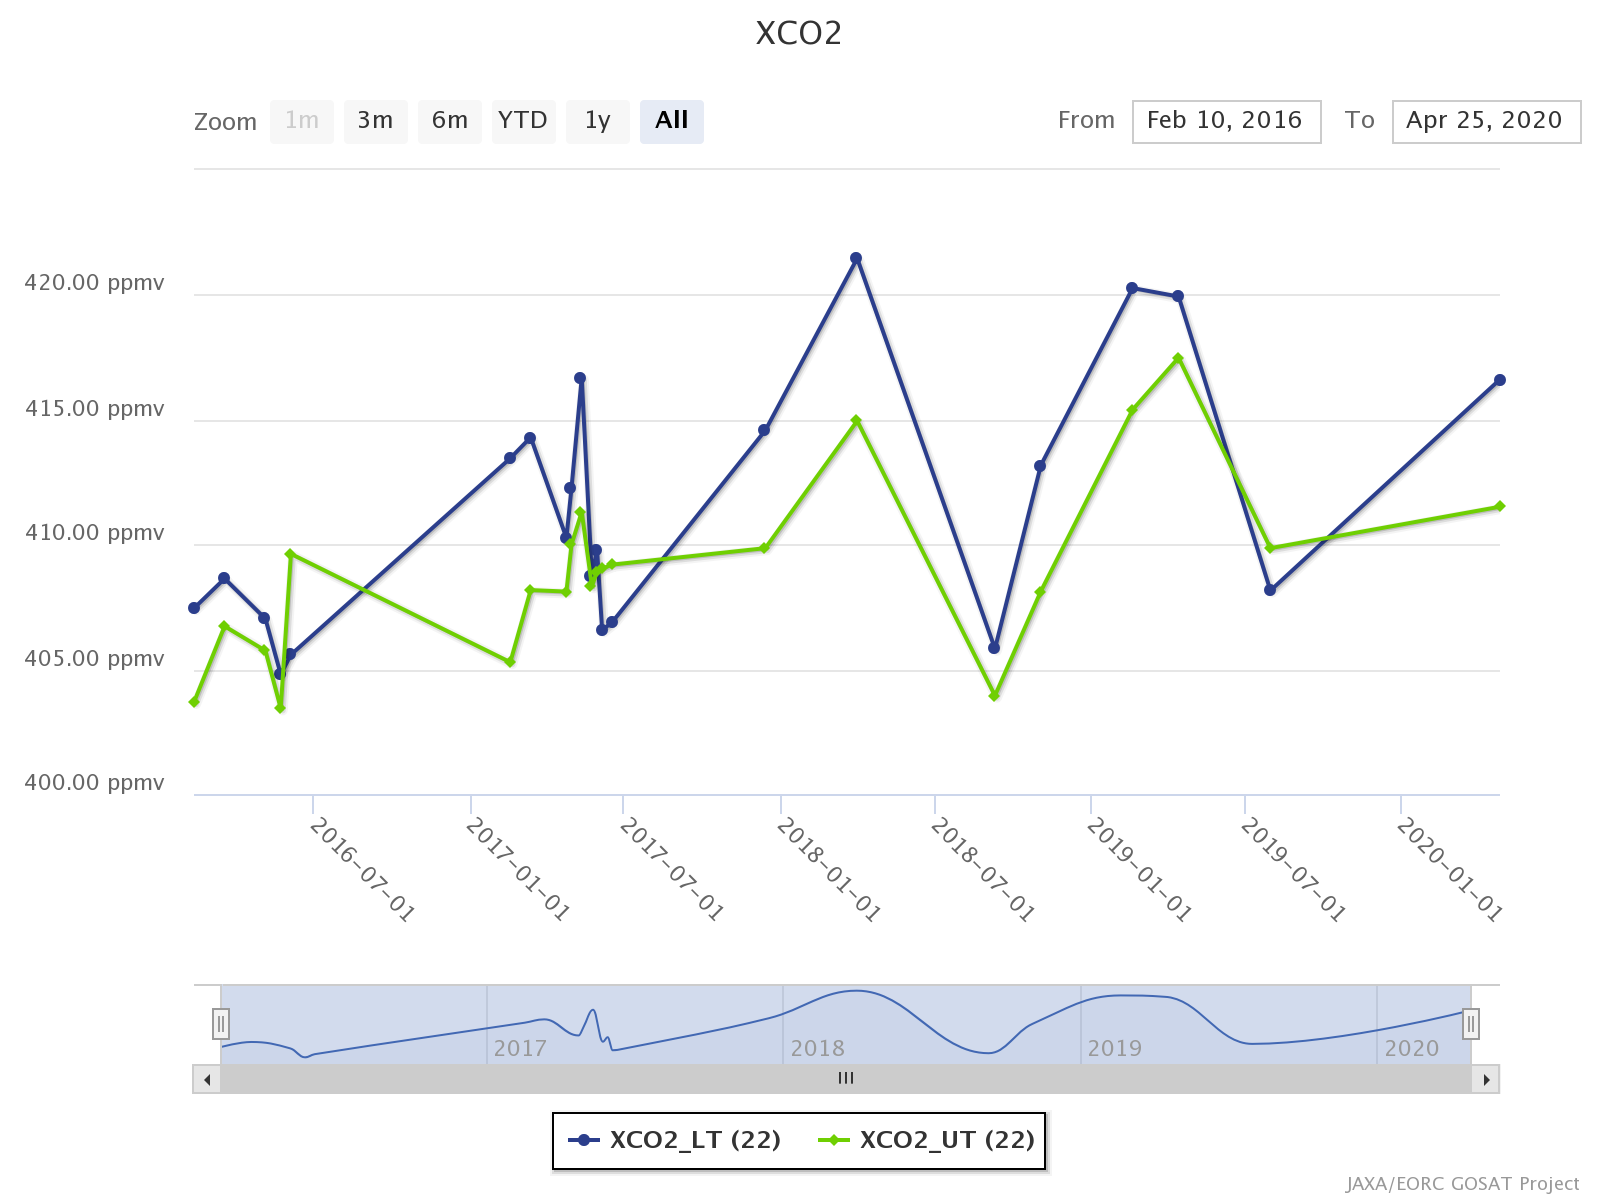
Carbon dioxide (CO2) and methane (CH4) partial column density of lower (approximately 0 -4 km) and upper (approximately 4 -12km) troposphere (LT and UT, respectively). Read more about GOSAT here
JAXA's Public-health Monitor and Analysis Platform (JPMAP)
dashboard hackathonhealthJAXAopen data
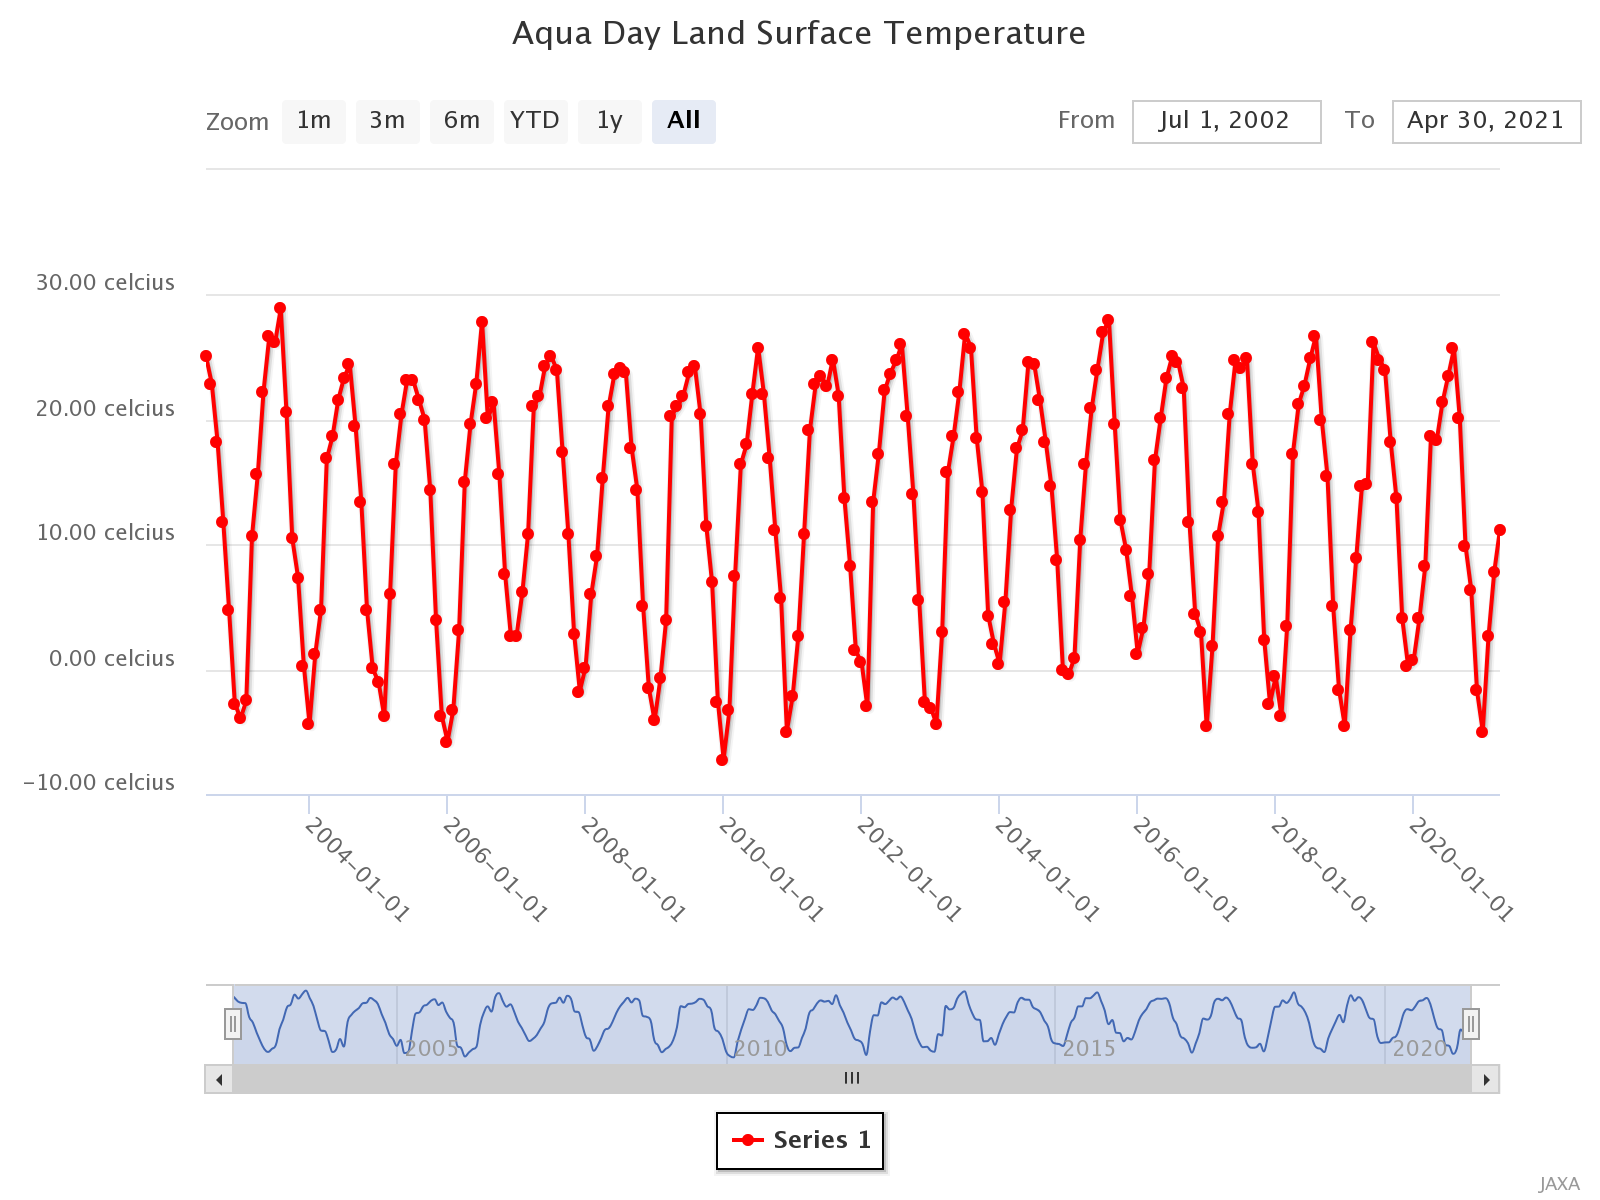
This is in cooperation with research institutes including universities and international organizations.EORC developed a user-friendly web-based system, JAXA's (Japan Aerospace Exploration Agency) Public-health Monitor and Analysis Platform (JPMAP), which distributes satellite-derived environmental information, such as rainfall, shortwave radiation, soil moisture, normalized difference vegetation index (NDVI), aerosol optical thickness (AOT), land surface temperature (LST), and altitude. The system was designed for users to download the data and utilize it without any additional data pro...
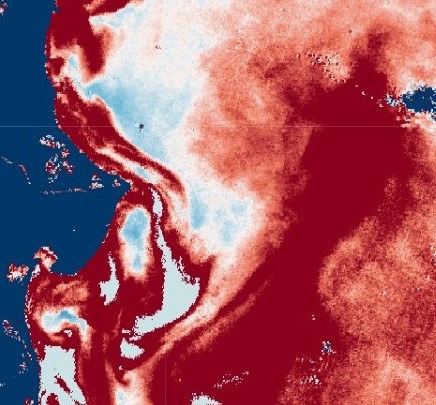
JAXA_wq_chla_anomaly
dashboard hackathonJAXAopen datarastersentinel hubwater quality
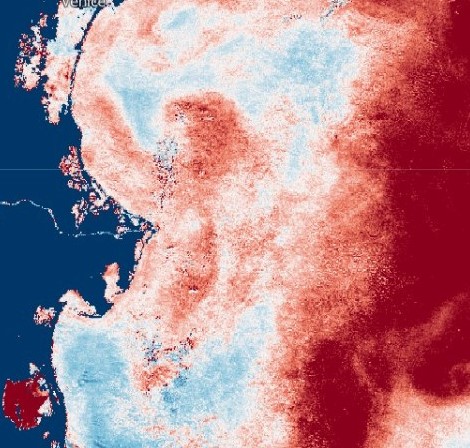
Water quality Chlorophyll-a weekly anomaly.
It is the ratio (percentage) of weekly chlorophyll-a concentration divided by average concentration of other years for 4 sites: North Adriatic, Tokyo, Kobe and Nagoya.
Anomaly[%]=((DN-1)/254*(300-(-100))-100).
The base data is made by averaging within -1, 0, +1 weeks in 2018-2020.
File naming convention:
jx_chla_tif_XXX_yyyy_mm_dd.tif
XXX: Area name
         nas -> NAdriatic
         tok -> Tokyo
         kob -> Kobe
         nag -> Nagoya
yyyy:Year
mm:Month
dd:DayJAXA_wq_chla_average
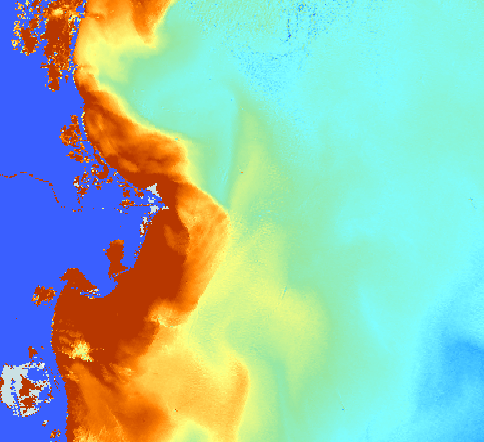
dashboard hackathonGCOM-CJAXAopen datarastersentinel hubwater quality
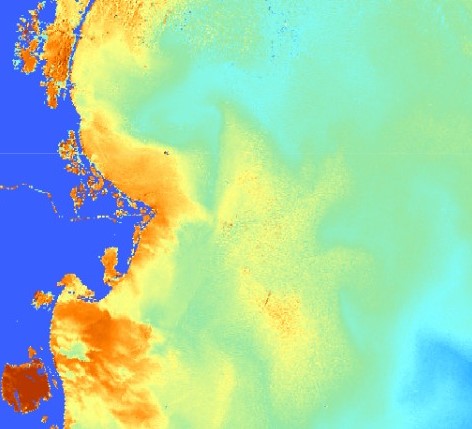
Chlorophyll-a concentration weekly average (GCOM-C). Weekly average chlorophyll-a concentration for 4 sites: North Adriatic, Tokyo, Kobe and Nagoya. chl[mg/m^3]=10.^(DN/254*(log10(60)-log10(0.03))+log10(0.03))
File naming convention: jx_chla-ave_tif_XXX_yyyy_mm_dd.tif
XXX: Area name
         nas -> NAdriatic
         tok -> Tokyo
         kob -> Kobe
         nag -> Nagoya
yyyy:Year
mm:Month
dd:DayJAXA_wq_tsm_anomaly
dashboard hackathonJAXAopen datarastersentinel hubwater quality
Ratio (percentage) of weekly total suspended matter concentration divided by average concentration of other years for 4 sites: North Adriatic, Tokyo, Kobe and Nagoya.
Anomaly[%]=((DN-1)/254*(300-(-100))-100).
The base data is made by averaging within -1, 0, +1 weeks in 2018-2020.
File naming convention: jx_tsm_tif_XXX_yyyy_mm_dd.tif
XXX: Area name
         nas -> NAdriatic
         tok -> Tokyo
         kob -> Kobe
         nag -> Nagoya
yyyy:Year
mm:Month
dd:DayJAXA_wq_tsm_average
dashboard hackathonGCOM-CJAXAopen datarastersentinel hubwater quality
Total suspended matter cocentration weekly average (GCOM-C). Weekly total suspended matter concentration for 4 sites: North Adriatic, Tokyo, Kobe and Nagoya. TSM[g/m^3]=10.^(DN/254*(log10(50)-log10(0.01))+log10(0.01))
File naming convention: jx_tsm-ave_tif_XXX_yyyy_mm_dd.tif
XXX: Area name
         nas -> NAdriatic
         tok -> Tokyo
         kob -> Kobe
         nag -> Nagoya
yyyy:Year
mm:Month
dd:Day