About
This registry exists to help people discover and share collections that are available via Euro Data Cube
See all usage examples for collections listed in this registry tagged with DanubeDataCube.
Search collections (currently 13 matching collections)
You are currently viewing a subset of data tagged with DanubeDataCube.
Add to this registry
If you want to add a collection or example of how to use a collection to this registry, please follow the instructions on the Euro Data Cube Public Collections GitHub repository.
Unless specifically stated in the applicable collection's documentation, collections available through the Euro Data Cube Public Collections are not provided and maintained by Euro Data Cube. Collections are provided and maintained by a variety of third parties under a variety of licenses. Please check collection licenses and related documentation to determine if a collection may be used for your application.
Ecosystem Map of Hungary
DanubeDataCubederived dataecosystemland covermachine learningopen datarastersentinel hubsystematicxcube
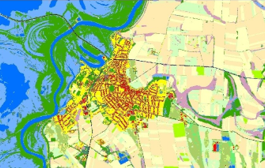
The Ecosystem Map of Hungary shows the distribution, extent and frequency of ecosystem types on national-scale. Although, mapping of agricultural and urban ecosystems was also a goal, the primary target areas of mapping were semi-natural areas. The map is suitable to serve as the basis of all further assessments of Ecosystem Services and green infrastructure. Top-down and bottom-up mapping approaches were combined to execute mapping, relying both on existing and regularly updated thematic databases and remote sensing images. The map was created within the frame of an EU-co-financed project: &...
Usage examples
National High Resolution Layer, Hungary
DanubeDataCubederived dataland covermachine learningopen datarastersentinel hubsystematicxcube
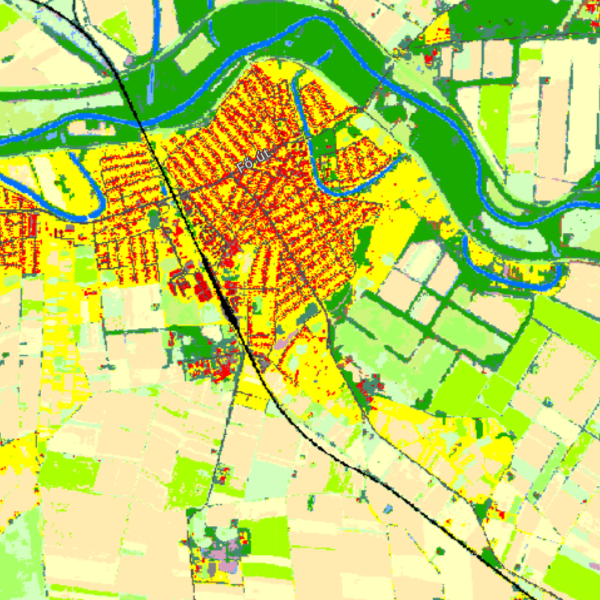
The concept of the NHRL was to create a dataset that provides wall-to-wall information on land cover, especially on land cover categories that can be more reliably identified by remote sensing methods. Its classification mixes land use and land cover elements according to human interest, providing map information from the built environment to agricultural cultivated areas and natural vegetation cover. In addition to the machine-learning process (Random Forest), its production includes data integration (roads - railways - buildings) and other data filtering steps to reduce data noise. In the fu...
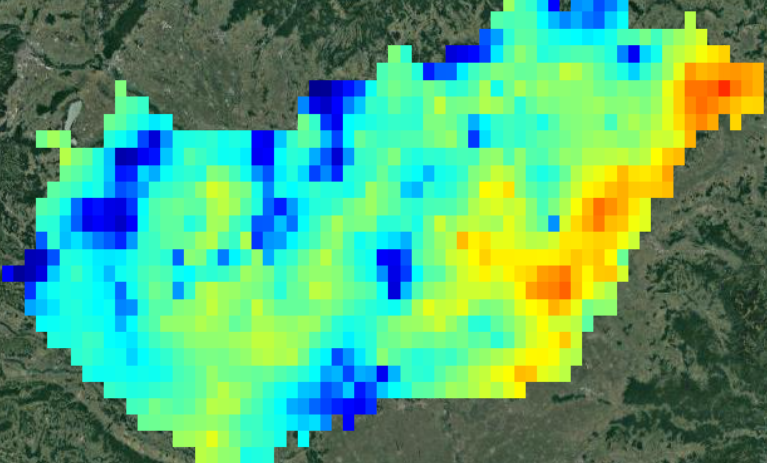
Percent of Normal Index (PNI)
DanubeDataCubederived datadrought indexmachine learningopen datarastersentinel hubsystematicxcube
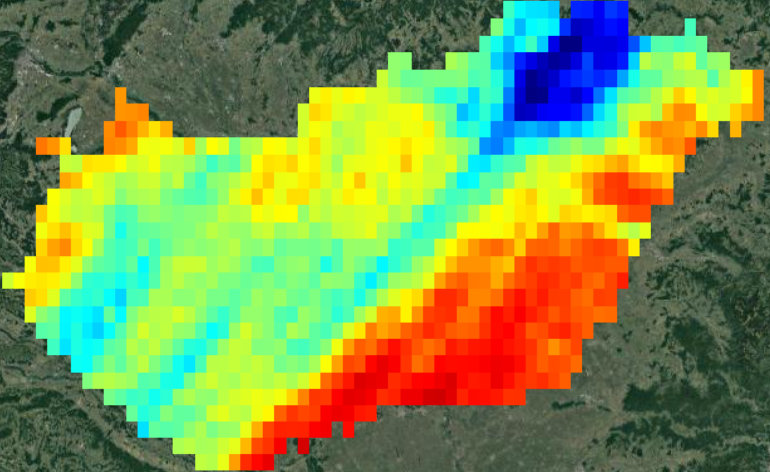
Percent of Normal Index (PNI) is calculated by dividing actual precipitation (for the previous 30 or 90 days) by normal precipitation for the time being considered (1991-2020) and multiplying by 100.
Standard Precipitation Evapotranspiration Index (SPEI)
DanubeDataCubederived datadrought indexmachine learningopen datarastersentinel hubsystematicxcube
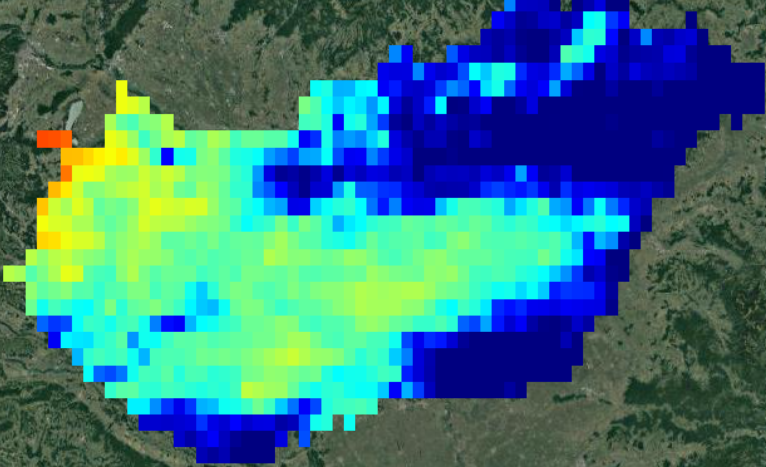
Standard Precipitation Evapotranspiration Index (SPEI) uses the basis of Standard Precipitation Index but includes a temperature component, allowing the index to account for the effect of temperature on drought development through a basic water balance calculation.
Standard Precipitation Index (SPI)
DanubeDataCubederived datadrought indexmachine learningopen datarastersentinel hubsystematicxcube
Standard Precipitation Index (SPI) quantifies observed precipitation as a standardized departure from a selected probability distribution function that models the raw precipitation data. The raw precipitation data are typically fitted to a gamma or a Pearson Type III distribution, and then transformed to a normal distribution.